They Already Have a Number
in Their Head.
The seller already has a price in their head. It came from Zillow, or what the neighbor got, or what they "need to walk away with." When they push back, you need more than comps. You need the rationale—the math that either validates their expectations or explains why the market says something different.
Without the rationale, it's your word against theirs.
They already have a number
Zillow gave them one. The neighbor's sale gave them another. Now they're walking into the listing appointment with expectations—and you need data that addresses those expectations directly.
The renovation ROI gap
They spent $60K on the kitchen. They expect $100K in added value. Without feature-level analysis that shows the actual market impact, you're stuck between validating unrealistic expectations or losing the listing.
Your opinion vs. their opinion
Without a transparent methodology, the pricing conversation becomes adversarial. They push back, you defend. The CMA should shift the argument from "agent vs. seller" to "seller vs. market reality."
"How did you get that number?"
When they ask—and they will—you need more than gut feel. You need the math. Dollar-impact adjustments they can see. A methodology they can follow. Rationale they can argue with (instead of you).
What if your CMA could show them exactly how you got the number?
From Address to Client-Ready
in Three Steps
Enter the Address
We pull property data, recent sales, active listings, and rental comps automatically. No manual searching across five different sites.
Select Analysis Type
Choose your analysis type (sale or rental), then select residential or commercial. Each uses tailored methodology for accurate pricing.
Get Your Reports
Two polished PDFs: a Strategy Guide for your prep and a Client Presentation with your branding. Both ready in about 15 minutes.
The old way
With PerfectListing
Your Comps Say $875K.
The Property Is Worth $999,900.
Here's the math.
Three townhomes sold on this block in St. Pete's Grand Central. Same modern build. Same walkable location. Each one: around $875K.
A basic CMA would price this one the same.
But this one has a 3.5-car climate-controlled garage in a 2-car market. 726 square feet of rooftop and deck space. Three bedrooms when most are two. That's $125,000 the spreadsheet missed.
How our CMA accounts for that:
THE BOTTOM LINE
$875,000 → $999,900
When the seller asks "how did you get this number?"
You have the answer.
We analyze what matters. Nothing that doesn't.
Garage config. Outdoor space. Floor level. HOA fees. Lot position. We assess dozens of factors—but only the ones relevant to your property type and comps.
Same rigorous methodology. Factors tailored to what actually affects your property's value.
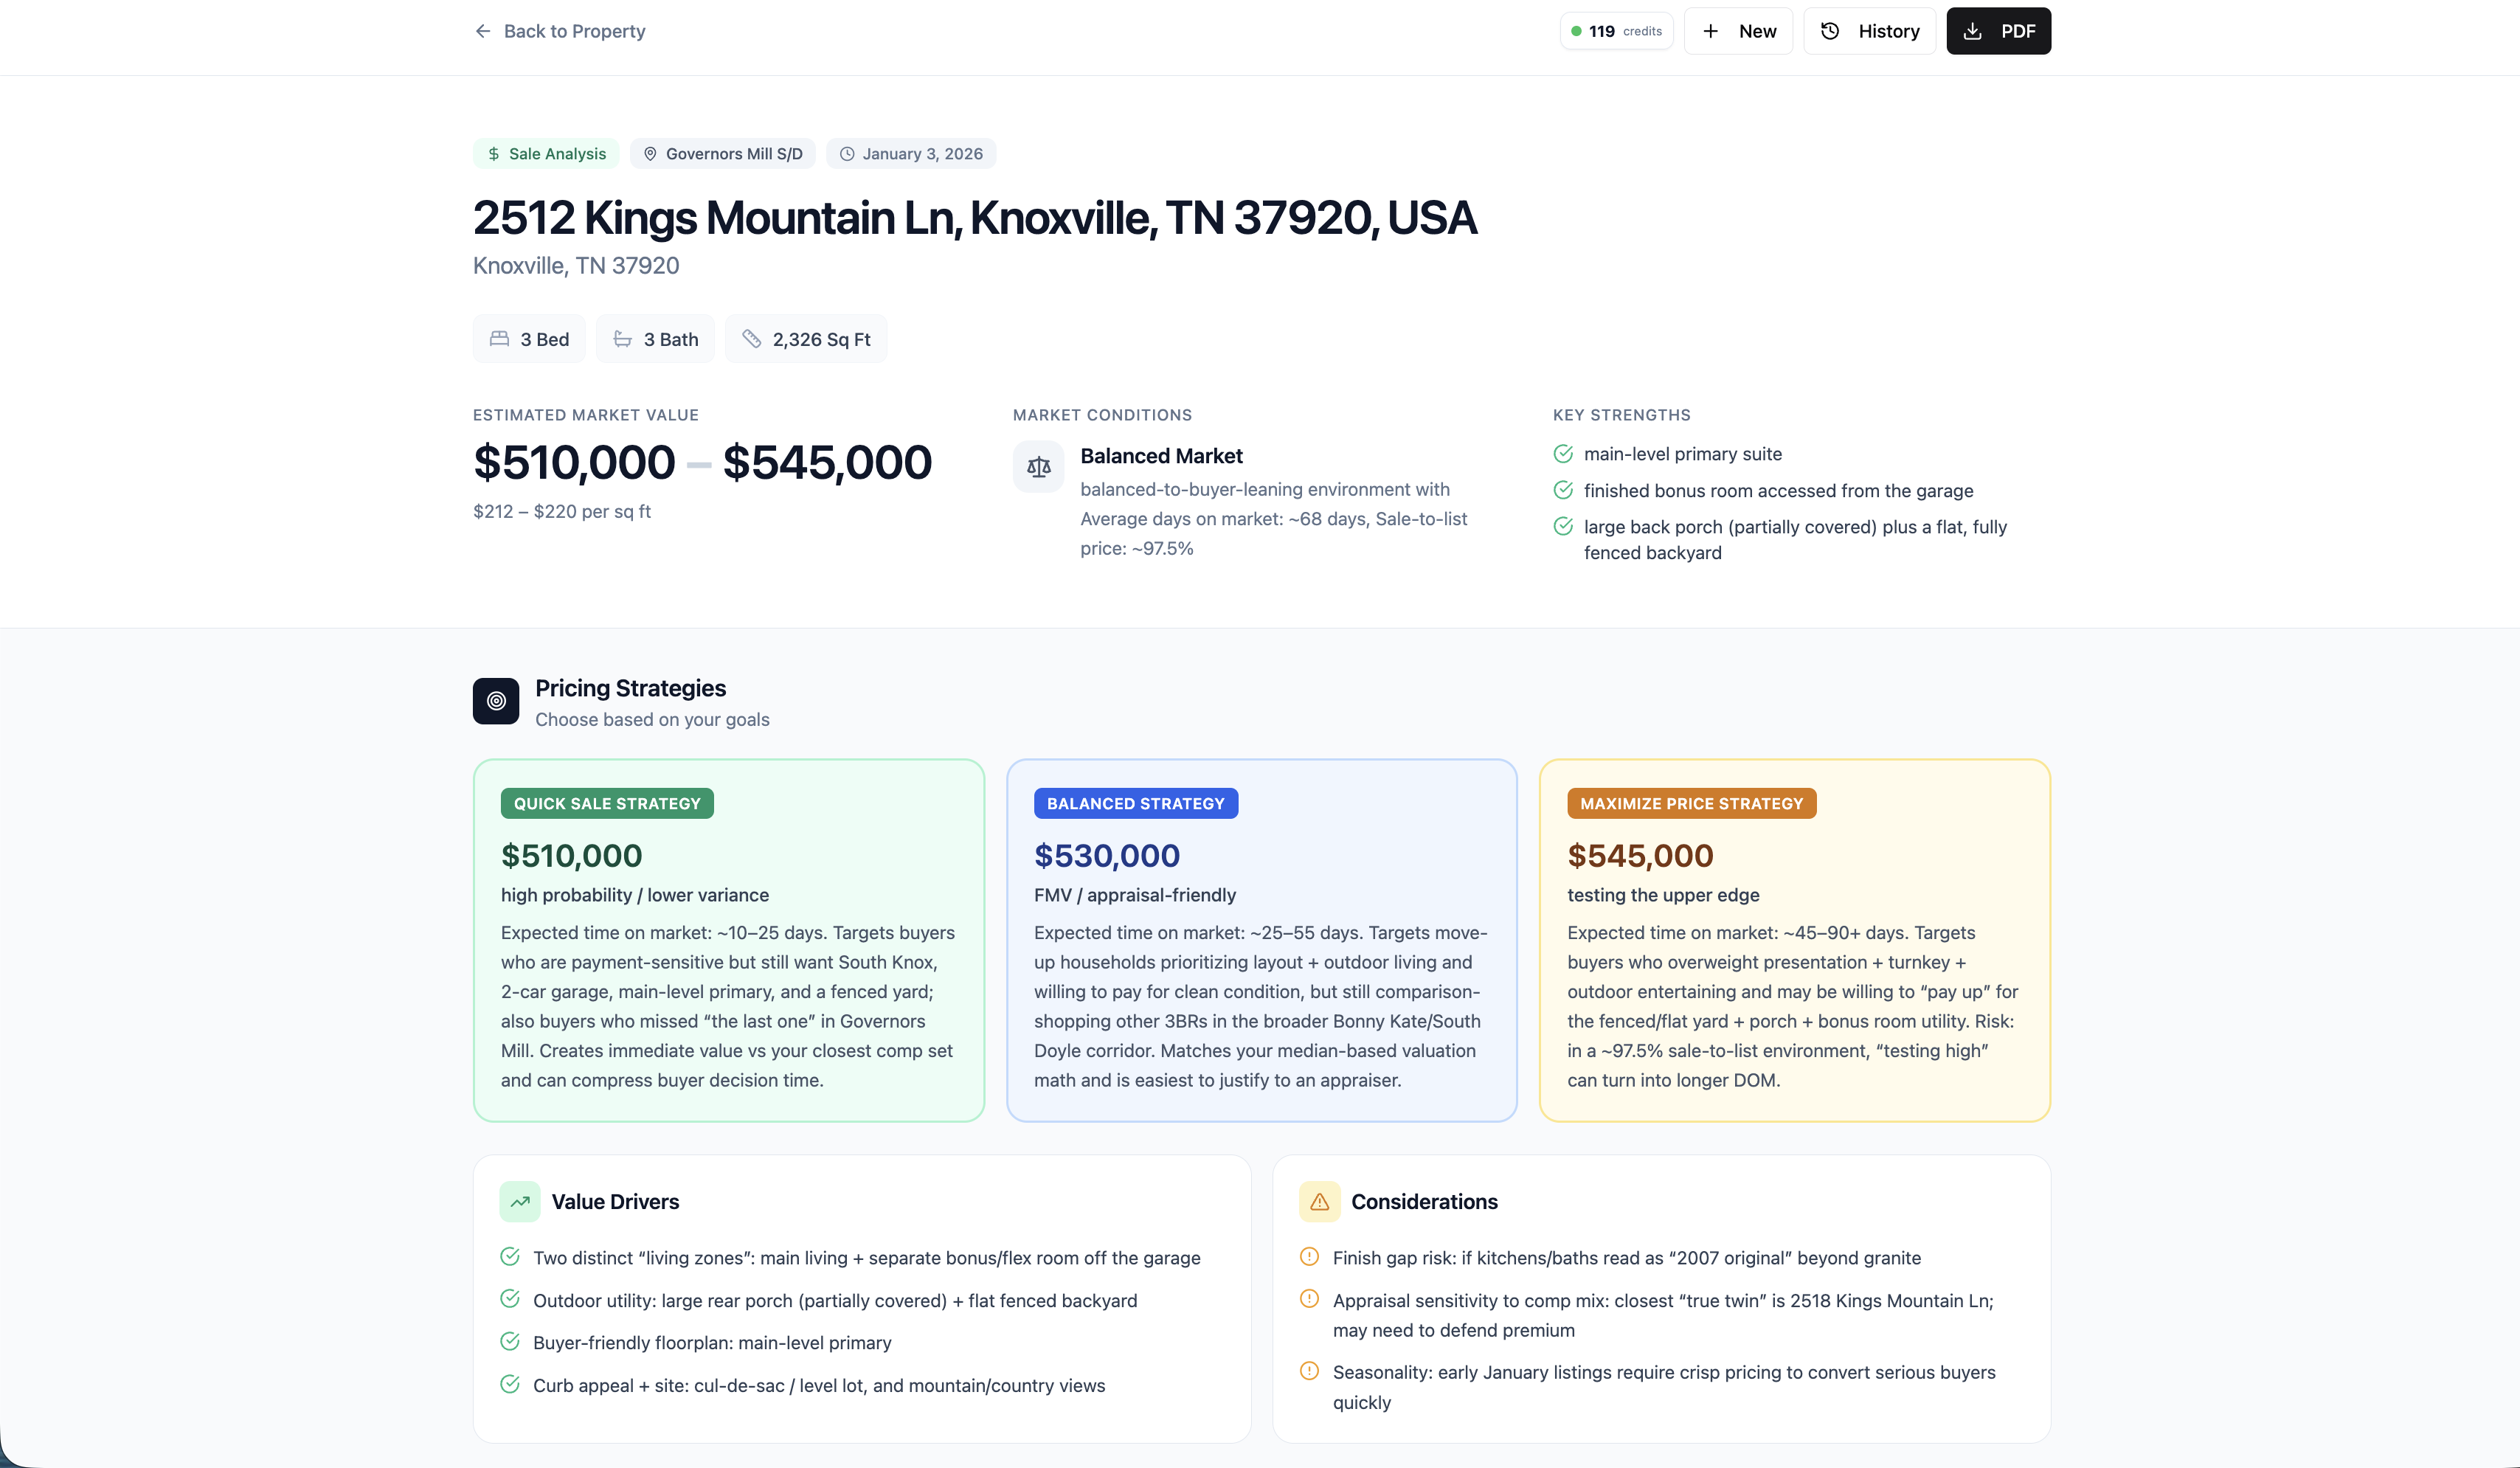
Three Numbers. Three Strategies.
One Confident Conversation.
Every CMA includes three pricing strategies with expected timelines, target buyers, and the reasoning behind each approach.
Lower price point to generate immediate interest and multiple offers. Pulls you closer to the core buyer pool.
Model-derived price based on comparable sales. The data-backed position without pretending you have premium positioning.
Premium positioning for buyers who pay for lifestyle. Accepts longer marketing time and higher probability of concessions.
Value Drivers
- Indoor-outdoor lifestyle execution: pool/spa + covered patio
- True turnkey remodel (not just cosmetic)
- Functional flexibility: main-level bed/bath
Considerations
- Premium-lot vs non-premium-lot gap in $/sf sales
- Solar terms: if leased/third-party, buyers price in complexity
- Active competitive anchors: nearby listings with pools in low-$600s
The CMA That Does the Research
So You Don't Have To
Traditional CMA
- Manual comp research across multiple sites
- Gut-feel pricing without confidence levels
- Generic spreadsheets or templates
- Same approach for sales and rentals
- No branding — just raw data
PerfectListing
- Real-time data from Zillow, Redfin, Realtor.com, and more
- Price ranges with confidence levels and market conditions
- Three pricing strategies with expected timelines
- Tailored analysis for residential, commercial, sales, and rentals
- Professional PDFs with your headshot, license, and brokerage
Everything You Need
In One Report
Multi-Source Intelligence
Pulls from Zillow, Redfin, Realtor.com, Apartments.com, Airbnb, VRBO. Current listings and recent sales — not stale data.
Reproducible Methodology
Not a black box. Transparent $/sqft calculations you can explain to clients. Reproducible methodology that gives you consistent, defensible results.
Market Conditions Insight
Know if it's a buyer's market, seller's market, or balanced before the listing appointment. Adjust your strategy accordingly.
Vacation Rental Intelligence
Seasonal pricing patterns, occupancy scenarios, platform fees, cleaning recommendations, local demand events.
Agent-Branded Reports
Your headshot, your license, your brokerage logo. Clients see a professional report, not a screenshot of Zillow.
Value Factors Analysis
What drives the price up? What to watch for? Clear explanations that translate to client conversations.
From Spreadsheet Chaos
to Client-Ready Confidence
"Let me check Zillow... now Redfin... wait, this sold data is from 6 months ago... okay, let me pull up my spreadsheet template..."
- Hours spent on manual research
- No defensible methodology
- Same template for every property type
- Your branding nowhere in sight
"Here's your property analysis. Based on 12 verified comparables, I recommend listing between $665,000 - $690,000. This is a seller's market — here are three pricing strategies..."
- 15 verified comps with detailed breakdowns
- Transparent $/sqft methodology you can explain
- Tailored for sales, rentals, or vacation properties
- Your headshot, license, and brokerage logo
Same data. Same property. Completely different presentation.
Commercial Properties Need
a Different Lens.
Investors and tenants don't care about curb appeal—they care about cap rates, NOI, lease terms, and tenant quality. Our commercial CMA adapts the same rigorous methodology to the metrics that actually drive commercial real estate decisions.
Commercial Sales
- Cap rate analysis
Against market benchmarks for asset class
- Net operating income
Verified income and expense breakdown
- Tenant quality
Credit strength and lease term stability
- Building classification
Class A/B/C positioning and condition
- Price per SF
Relative to comparable transactions
Commercial Rentals
- Market vs. in-place rent
Current rents vs. achievable rates
- Lease structure
Triple-net, gross, or modified terms
- Tenant improvements
TI allowance and build-out costs
- Vacancy context
Submarket absorption and competition
- Comparable leases
Recent deals in the submarket
Tailored analysis for every commercial asset class.
Different property types require different evaluation criteria. We analyze what matters for your specific asset.
Same methodology. Different value drivers. One confident conversation with your investor clients.
Questions About AI CMAs
Know Your Number
Before the Listing Appointment
Stop guessing. Start presenting data-backed valuations that win listings — with CMAs that see the pool, the kitchen remodel, and the premium lot.